Pandas
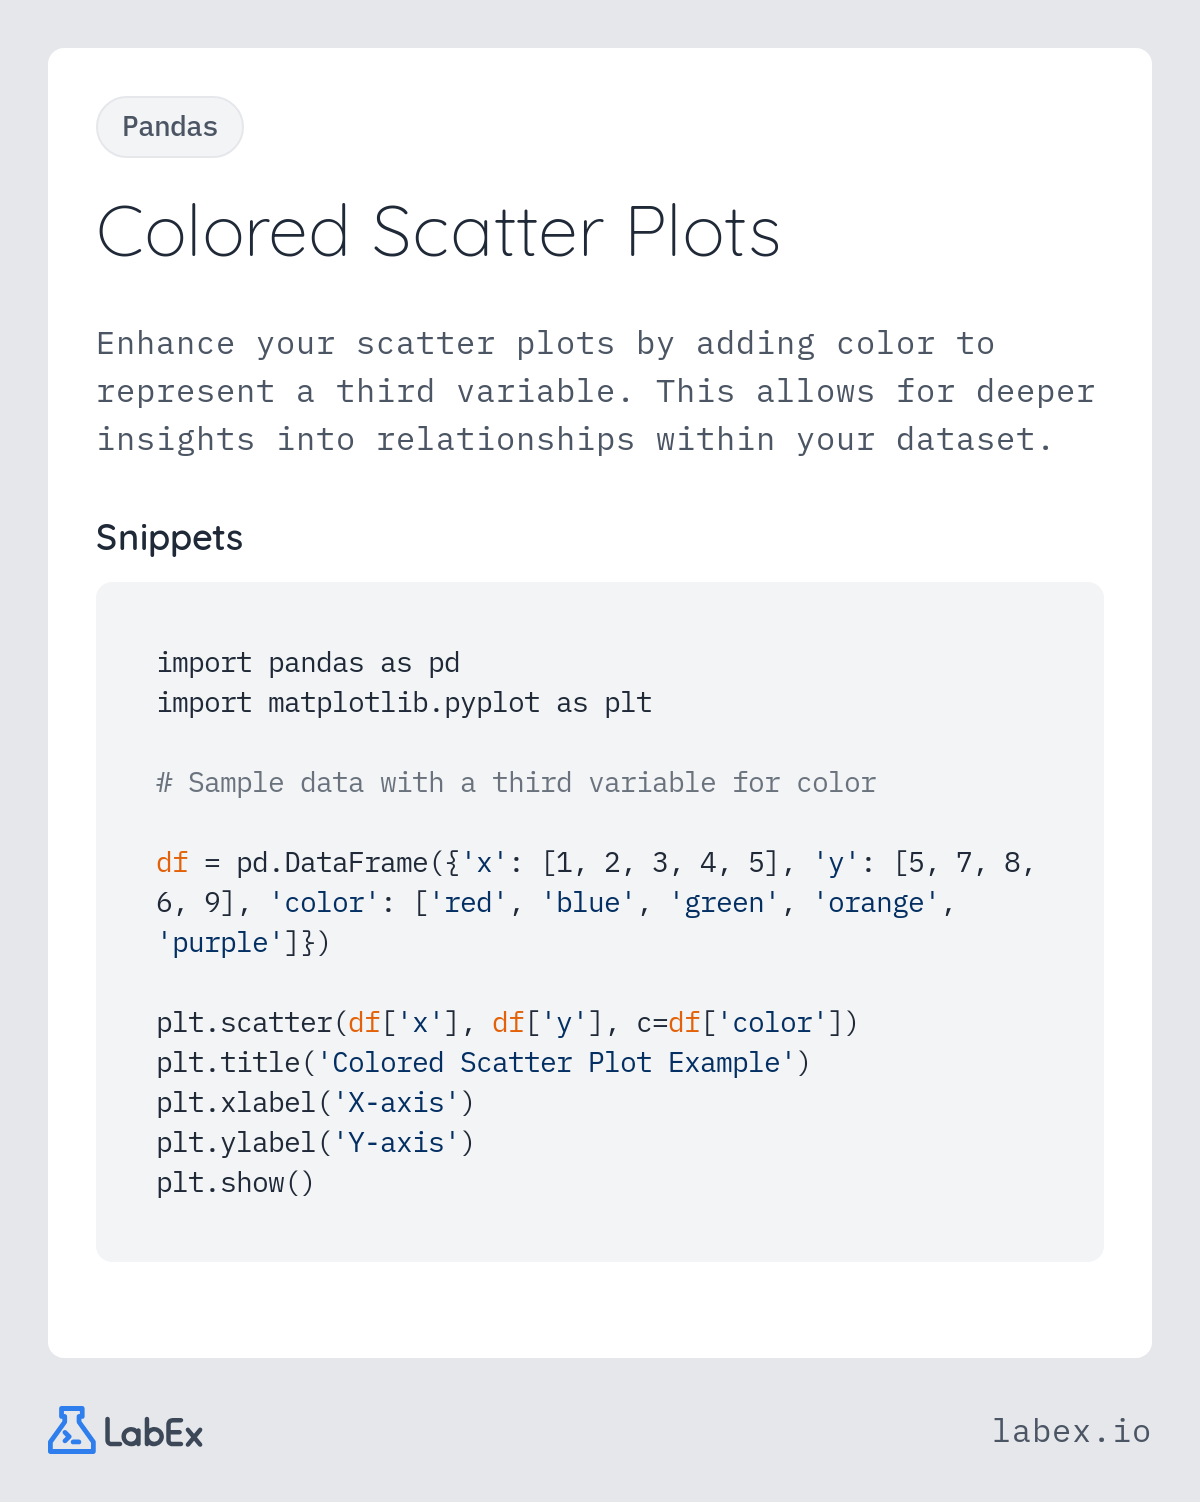
Colored Scatter Plots
Enhance your scatter plots by adding color to represent a third variable. This allows for deeper insights into relationships within your dataset.
Explore our curated collection of programming flashcards. Each card contains practical examples and code snippets to help you master programming concepts quickly.