Matplotlib
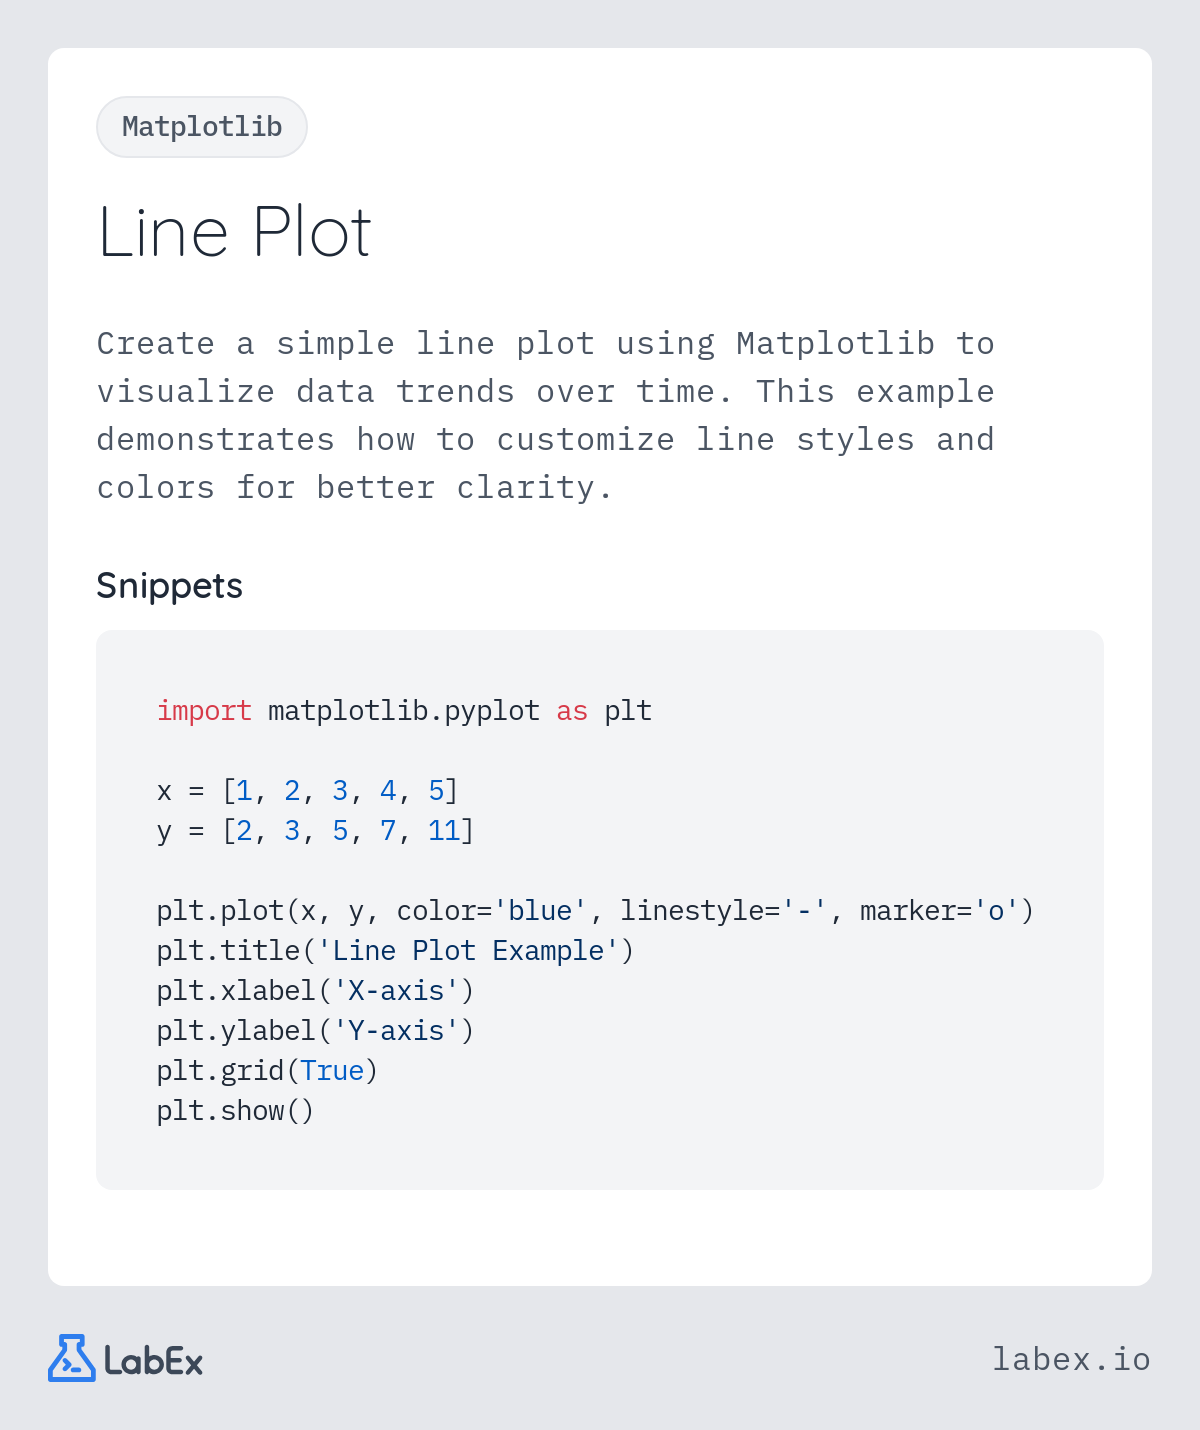
Line Plots
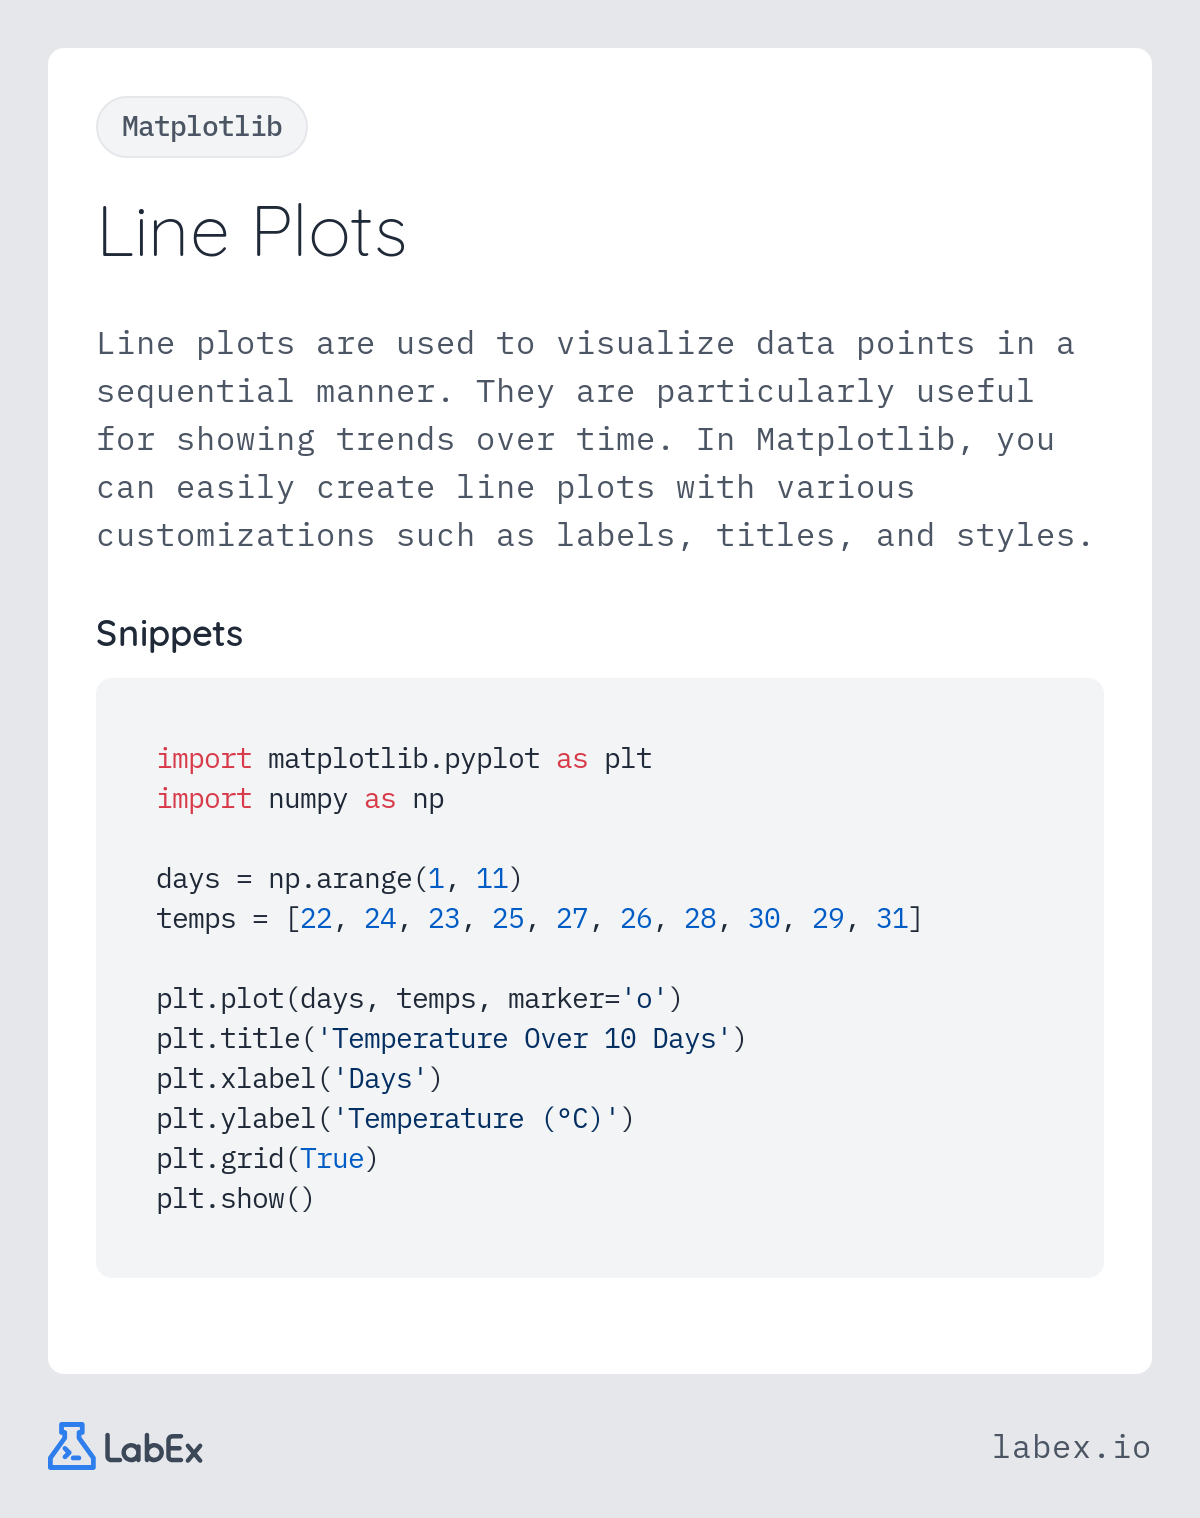
Line plots are used to visualize data points in a sequential manner. They are particularly useful for showing trends over time. In Matplotlib, you can easily create line plots with various customizations such as labels, titles, and styles.